 |
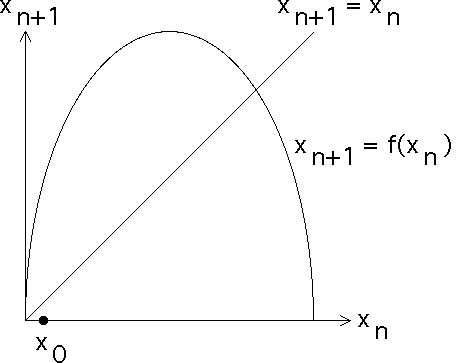
| To represent the dynamics of this process, we label the
x-axis xn and the y-axis xn+1. |
| That is, if the x-coordinate
of a point is one of the xn, then the y-coordinate is xn+1,
the next value of the sequence. |
| We will represent the sequence of values x0, x1,
x2, x3, ... by the sequence of points |
| (x0, x0), (x1, x1),
(x2, x2), ... |
| To do this, we need to include the graph of xn+1 =
xn and of xn+1 = f(xn). |
| Select the
starting value x0 and plot the point (x0, 0) |
| Click the picture to see the next step. |
