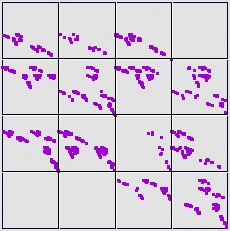
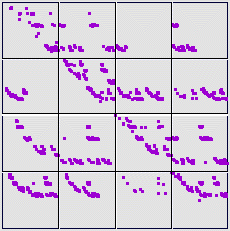
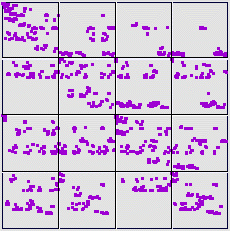
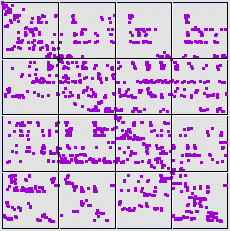
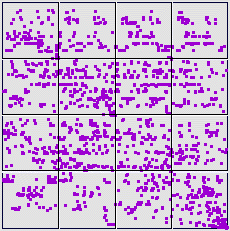
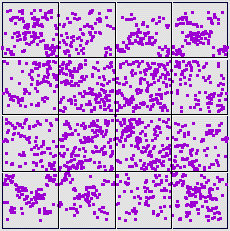
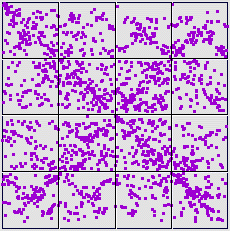
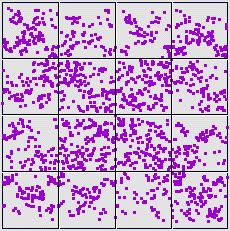
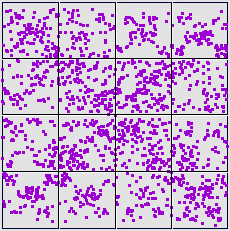
| 14. Here are equal size bin difference plots for differences of 1 (a), 2 (b),
3 (c), 4 (d), 5 (e), 10 (f), 50 (g),
100 (h), and 200 (i). |
| As the delay gets longer, the driven IFS fills more uniformly, though we see a clustering of
points along the (1, 0) to (0, 1) line, and along the
(0, 0) to (1, 1). |
| This is a signature of differences landing in bins 2 and 3, in all combinations, and
in bins 1 and 4, in all combinations. |
| Comparing 13 (i) and 14 (i), we see with equal-size bins more differences fall in bins 2 and 3. |
| Consequently, converting to equal weight bins reduces the size of bins 2 and 3, allowing more
transitions between bins 1 and 4. |
