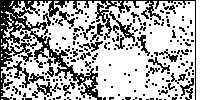

We use the four transformations
| T1(x, y) = (x/2, y/2), the midpoint of |
| T2(x, y) = (x/2, y/2) + (1/2, 0), the midpoint of |
| T3(x, y) = (x/2, y/2) + (0, 1/2), the midpoint of |
| T4(x, y) = (x/2, y/2) + (1/2, 1/2), the midpoint of |
| Starting from a point |
| To the extent that the square does not fill in
uniformly, we can make deductions about the nonrandomness of the sequence |
Two issues remain:
| how to interpret any departures from uniform fill of the square, and |  |
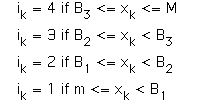
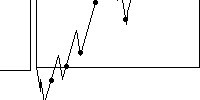
| how to convert a time series |
 |
| Finally, we shall compare real financial data with the self-affine cartoons developed by Benoit Mandelbrot. |  |
Return to Driven IFS and Financial Cartoons