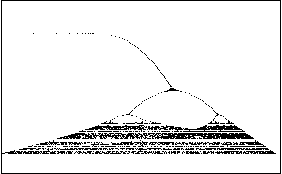
| Newton's method can fail to converge in ways more serious than encountering
a horizontal tangent. For some f(x), Newton's method can converge to a cycle,
and thus the iterations NEVER settle down to a fixed value. |
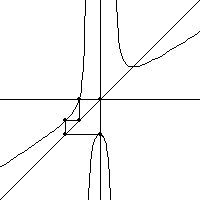
| For an example, we take the function f(x) = x3 + (r-1)x - r.
Here is a plot of the Nf(x) for r = 0.51. |
|
| On the left side, graphical iteration of Nf(x) starting from
x = 0 converges to a 3-cycle. |
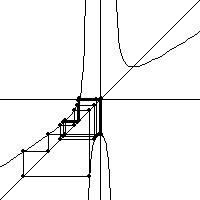
| In the middle, starting from x = -0.1 appears to converge to the same
3-cycle. |
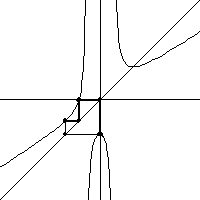
| The right image is the middle, dropping the first 10 points of the
graphical iteration plot. Indeed, we do see a 3-cycle. Moreover, this
3-cycle is stable. |
| |
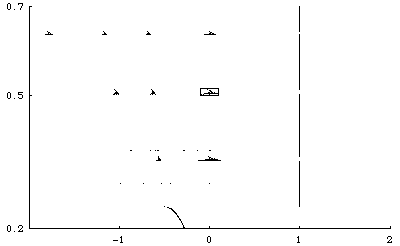
| For the same reason that the Mandelbrot set iteration starts with
z = 0, these Newton's method experiments start from x = 0. |
| On the left, for r ranging between 0.2 and 0.7 we plot the
graphical iterates of x = 0. Note many converge to the root x = 1, but
some exhibit more complicated behavior. |
| The right picture is a magnification of the small box on the left.
Does this look familiar? |
|