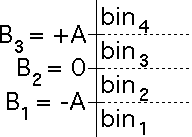
So we take
B2, the boundary between bin2 and bin3, to be 0, and
place B1 and B3 symmetrically about B2 = 0.
| The amount of visible structure depends on how large A, the distance from
B1 and B3 to B2, is relative to the clustering of the
differences about B2 = 0. |
 |
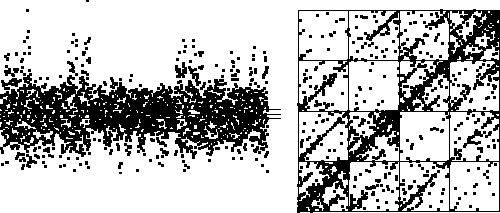
| Here are some examples. We show the time series of successive differences and the
driven IFS. |
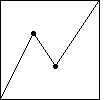 |
Here
we use the cartoon with generator having turning points
(1/3,2/3) and (5/9,1/3). We take B2 = 0 and
B1 and B3 one-quarter the range of values on either side of B2. |
 |
Here
we use the cartoon with generator having turning points
(1/3,2/3) and (5/9,1/3). We take B2 = 0 and
B1 and B3 one-tenth the range of values on either side of B2. |
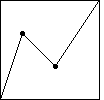 |
Here
we use the cartoon with generator having turning points
(2/9,2/3) and (5/9,1/3). We take B2 = 0 and
B1 and B3 one-quarter the range of values on either side of B2. |
 |
Here
we use the cartoon with generator having turning points
(2/9,2/3) and (5/9,1/3). We take B2 = 0 and
B1 and B3 one-tenth the range of values on either side of B2. |
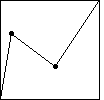 |
Here
we use the cartoon with generator having turning points
(1/9,2/3) and (5/9,1/3). We take B2 = 0 and
B1 and B3 one-quarter the range of values on either side of B2. |
 |
Here
we use the cartoon with generator having turning points
(2/9,2/3) and (5/9,1/3). We take B2 = 0 and
B1 and B3 one-tenth the range of values on either side of B2. |
|
| From these examples, we see that as the x coordinate of the turning point
(x,2/3) decreases toward 0, the range of the differences increases
and the majority of the differences cluster ever more closely (relative to the range)
about 0. |
| Consequently, in order for the IFS to reveal much structure, B1 and
B3 must be placed closer to 0. |
| To more illustrate the effect of placement of B1 and B3, here we
let the bin boundaries range from .025 of the range to .30 of the range,
in steps of .025. |
 |
| Click the picture to animate. |
|


