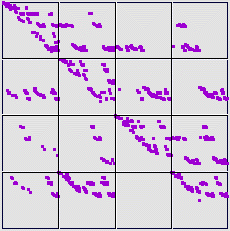
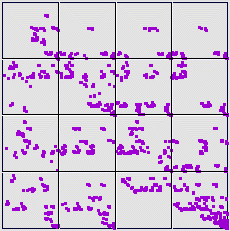
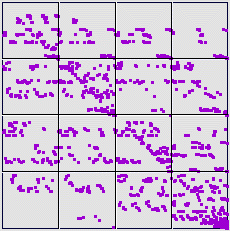
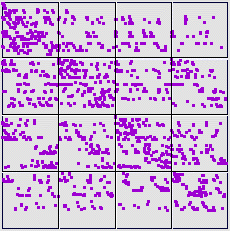
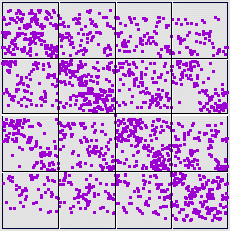
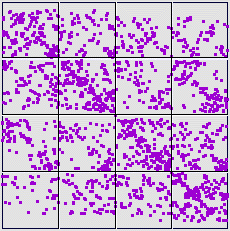
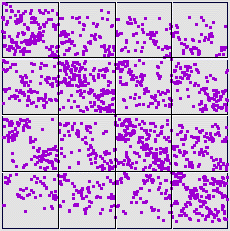
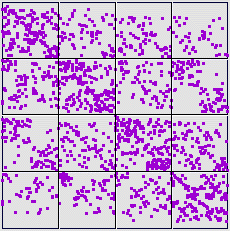
| 13. Here are equal size bin difference plots for differences of 1 (a), 2 (b),
3 (c), 4 (d), 5 (e), 10 (f), 50 (g),
100 (h), and 200 (i). |
| As the delay gets longer, the driven IFS fills more uniformly, though we see a clustering of
points along the (1, 0) to (0, 1) line. |
| This is a signature of differences landing in bins 2 and 3, in all combinations. |
| Also, the horizontal lines at the top and bottom of the driven IFS square are relatively
unoccupied. |
| This corresponds to few long strings of differences in bins 1 and 2, and few long
strings of differences in bins 3 and 4. |

