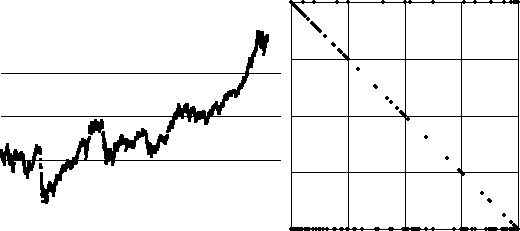
| The backwards Z is a common feature for
these driven IFS. |
| The first several hundred data points hop across
the boundary between bin 1 and
bin 2 giving IFS points along the line between (0, 0)
and (1, 0). |
| Then several hundred data
points are in bin 1, producing a sequence of IFS
points along the line from (1, 0) to (0, 0),
converging to (0, 0). |
| Next some data points hop
between bin 1 and bin 2, giving more IFS points along the
line between (0, 0) and (1, 0). |
| Then data points in bin 2 produce a sequence of IFS points
converging to (1, 0). |
| Next the data points hop between bin 2 and bin 3,
producing a sequence of IFS points along the line between
(1, 0) and (0, 1). |
| These are followed by data points in bin 3, giving
a sequence of IFS points converging to (0, 1). |
| The next data points make a fairly quick
transition to bin 4, producing a few IFS points on
the line between (0, 1) and (1, 1). |
| Finally, the data points in bin 4 produce a sequence of IFS
points converging to (1, 1). |
| Only points jumping more than a quarter of the range of the data values
would give rise to IFS points not on this backwards Z. |
| Certainly, this is not an interesting representation of the data. |

