Data Analysis by Driven IFS
Sample
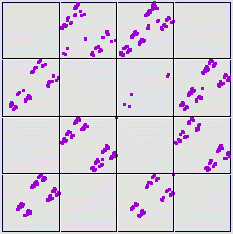
Here are the time series and the driven IFS.
| Under quick inspection the time series reveals few obvious patterns. |
| A |
There appear to be more points in bins 1 and 4 than in bins 2 and 3. |
| B |
There appear to be clumps of points along the top of bin 4. |
| C |
There appear to be several smallish clumps along the bin 3 - bin 4 boundary. |
| D |
About one-tenth of the way from the left side, the points organize themselves
into five short horizontal bands. |
|
What can the driven IFS tell us about these observations?
Finally, the Address Stats data to begin to assess how the likelihood
of landing in a bin is affected by the previous bin occupied.
Return to Sample.


