| 1. Which f(α) curve corresponds to which IFS picture? Justify your choices. |
(a)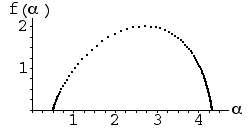 (b)
(b)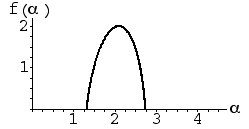 |
| |
(c)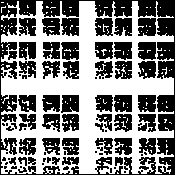 (d)
(d)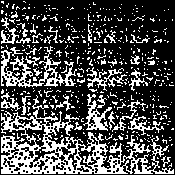 (e)
(e)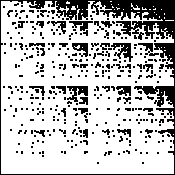 |
| Here is the solution. |
| |
| 2. Which f(α) curve corresponds to which IFS picture? Give a reason for each
choice. "Elimination" is not a valid reason for your third choice. |
(a) (b)
(b)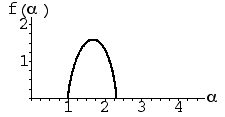 (c)
(c)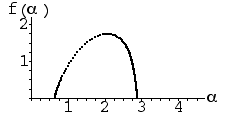 |
| |
(d)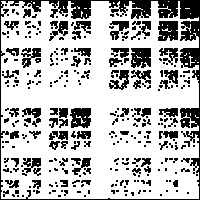 (e)
(e)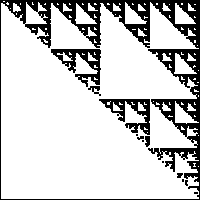 (f)
(f) |
| Here is the solution. |
| |
| 3. Both these f(α) curves were produced by IFS with four transformations
generating the filled-in square. One is generated with p1 = 0.15,
p2 = 0.20, p3 = 0.25,
p4 = 0.40: the other by p1 = 0.15,
p2 = 0.15, p3 = 0.30,
p4 = 0.40. |
| Say which is which and justify your choice. |
(a)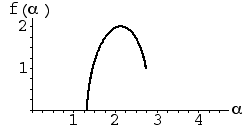 (b)
(b) |
| Here is the solution. |
| |
| 4. Each these f(α) curves were generated by IFS with four transformations
generating the filled-in square. One is generated with
|
| (a) p1 = 0.1, p2 = 0.1, p3 = 0.2, p4 = 0.6 |
| (b) p1 = 0.1, p2 = 0.1, p3 = 0.1, p4 = 0.7 |
| (c) p1 = 0.05, p2 = 0.15, p3 = 0.4, p4 = 0.4 |
| Say which is which and justify your choice. Again, "elimination" is not a valid justification. |
(d)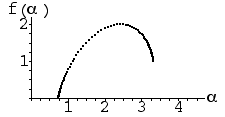 (e)
(e)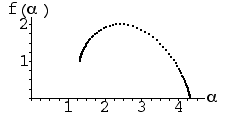 (f)
(f)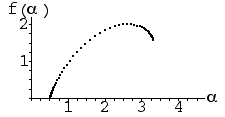 |
| Here is the solution. |
| |
| 5. Consider the multifractral generated by this IFS. |
| r |
s |
θ |
φ |
e |
f |
prob |
| 0.5 |
0.5 |
0 |
0 |
0 |
0 |
0.3 |
| 0.5 |
0.5 |
0 |
0 |
0.5 |
0 |
0.3 |
| 0.5 |
0.5 |
0 |
0 |
0 |
0.5 |
0.3 |
| 0.5 |
0.5 |
0 |
0 |
0.5 |
0.5 |
0.1 |
|
| (a) Show the highest probability in any length N address square is 0.3N. (Hint:
refer to this example.) |
| (b) The corresponding α value is Log(prob)/Log(square side length).
Compute this value. The answer should be a decimal. |
| (c) Describe the shape of the length N address squares on which this value of
α occurs. That is, in the limit of smaller and smaller squares, to what familiar fractal will this
shape converge? |
| (d) Show the lowest probability in any length N address square is 0.1N. |
| (e) Compute the corresponding α value. |
| (f) Describe the shape of the length N address squares on which this value of
α occurs. That is, in the limit of smaller and smaller squares, to what familiar geometric object
will this shape converge? |
| (g) Sketch the f(α) curve. In your sketch include the left and right endpoints of the
graph, and the height of the highest point of the graph. (You need not indicate the α value at
which that maximum height is attained.) Explain how you deduced the main features of your sketch. |
| Here is the solution. |
| |
| 6. In this exercise we investigate what happens to the f(α) curve when all the
probabilities are equal. Assume all the scaling fators ri are
equal, and that their common value is r. Refer to
this page for the relevant formulas. |
| (a) If p1 = ... = pN, show each pi = 1/N.
(Recall for probabilities p1 + ... + pN = 1.) |
| (b) Show τ(q) = (q-1)Log(N)/Log(r). |
| (c) Show α(q) equals the similarity dimension, for all values of q. |
| (d) What value does f(α(q)) take? When you get the algebra into the right form,
you'll recognize the value as a familiar formula. |
| (e) Shetch the f(α) curve for this IFS. A hand-drawn sketch is fine. |
| r |
s |
θ |
φ |
e |
f |
prob |
| 1/2 |
1/2 |
0 |
0 |
0 |
0 |
1/3 |
| 1/2 |
1/2 |
0 |
0 |
1/2 |
0 |
1/3 |
| 1/2 |
1/2 |
0 |
0 |
0 |
1/2 |
1/3 |
|
| Here is the solution. |
| |
| 7. Pictured below are stylized driven IFS, one suggesting persistent fractional
Brownian motion (fBm), the other antipersistent fBm. Say which is which and justify your
choice. |
(a)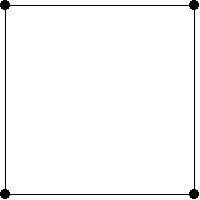 (b)
(b)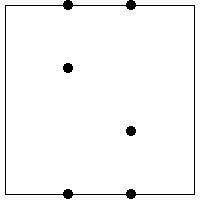 |
| Here is the solution. |
| |
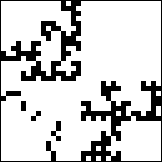
| 8. Does this figure represent a
self-similar
distribution? Support your answer with a calculation similar to that given in the reference. |
 |
| Here is the solution. |
| |
| 9. A bug that moves left or right according to the toss of a fair coin executes an instance
of Brownian motion. Replacing a fair coin by an unfair coin can cause departures from Brownian
motion. Determine if these bugs execute instances of persistent fractional Brownian motion,
antipersistent fractional Brownian motion, or a Levy flight. Explain your choices. |
| (a) Suppose the coin is loaded, say the probability of getting heads is .75. |
| (b) Suppose if heads has just occurred, the probability of getting heads again is .75, and
if tails has just occurred, the probability of getting tails again is .75. |
| Here is the solution. |
| |
| 10. Which f(α) curve corresponds to which IFS picture? Give a reason for each
choice. "Elimination" is not a valid reason for your third choice. |
(a) (b)
(b) (c)
(c) |
| |
(d)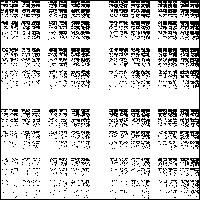 (e)
(e) (f)
(f)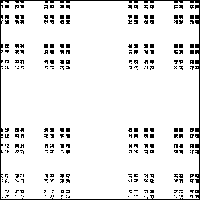 |
| Here is the solution. |
| |
| 11. Suppose we have a 2 function IFS on the unit interval:
T1(x) = x/2 and T2(x) = x/2 + 1/2. Say the
probability of applying T1 is 2/5 and the probability of
applying T2 is 3/5. |
| (a) Find the probability of each of the eight length 3 addresses. For example,
the probability of being in address 111 is the probability of applying T1
three times in succession, that is, (2/5)3 = .064. As in this example, give both
the fractional and decimal expression of the probabilities. |
| (b) Compute the Hölder exponent of each length three address. |
| (c) List each value of the Hölder exponent found in (b), and for each α
list the number, Num(α), of intervals on which that value of α occurs. |
| (d) Solve Num(α) = (1/8)-f(α) for f(α). |
| (e) Use (c) and (d) to compute points on the f(α) curve. (In fact, these points
lie on an approximation of the f(α) curve. Much longer addresses are needed to make a
better approximation.) |
| Here is the solution. |
| |
| 12. Suppose an N = 2 random Cantor set is constructed by selecting each scaling
uniformly randomly in the range [1/4, 1/2]. |
| (a) Using E(rd) = (4/(d+1))((1/2)d+1 - (1/4)d+1),
write the random Moran equation for finding the expected value of the dimension of this
Cantor set. |
| (b) Solve the equation of (a). This must be done numerically. |
| Here is the solution. |
| |
| 13. Which f(α) curve corresponds to which IFS picture? Give a reason for each
choice. "Elimination" is not a valid reason for your second choice. |
(a)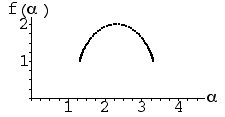 (b)
(b)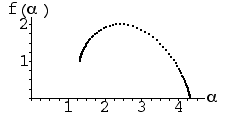 |
| |
(c)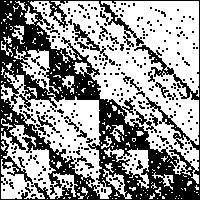 (d)
(d)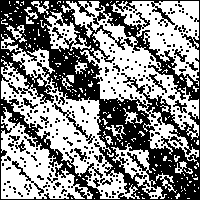 |
| Here is the solution. |
| |
| 14. Consider the multifractral generated by this IFS. |
| r |
s |
θ |
φ |
e |
f |
prob |
| 0.5 |
0.5 |
0 |
0 |
0 |
0 |
0.4 |
| 0.5 |
0.5 |
0 |
0 |
0.5 |
0 |
0.4 |
| 0.5 |
0.5 |
0 |
0 |
0 |
0.5 |
0.1 |
| 0.5 |
0.5 |
0 |
0 |
0.5 |
0.5 |
0.1 |
|
| (a) The length 1 addresses with highest probability are 1 and 2, with
Prob(1) = Prob(2) = 0.4. The length 1 addresses with lowest probability are
3 and 4, with Prob(3) = Prob(4) = 0.1. Find the length 2 and 3 addresses
with lowest and highest probabilities. Find those probabilities. |
| (b) Find the α values corresponding to the probabilities found in (a). Express
these α values as ratios of logarithms, and find a numerical approximation accurate to
three digits to the right of the decimal. |
| (c) Find the minimum and maximum length n address α values for all n. |
| (d) Find the dimensions of the sets on which the minimum and maximum α
values occur, in the n → ∞ limit. |
| Here is the solution. |
| |
| 15. Suppose we construct a randomized Cantor set by this process: start with the unit
interval and at each stage, replace every interval by two subintervals, both scaled by a
factor of r, where each r is a number picked randomly between r = 1/5 and
r = 1/4, both with probability 1/2. |
| (a) Find the maximum and minimum possible dimensions of Cantor sets constructed
in this way. |
| (b) Find the expected value of the dimension. In this case, the expected value
version of the Moran equation is |
| 1 | = E(r1d + r1d) |
| = (1/2)((1/4)d + (1/4)d) +
(1/2)((1/5)d + (1/5)d) |
|
| Is this the average of the
dimensions found in (a)? |
| (c) How does the expected value of the dimension change if r = 1/5
is picked with probability 1/3 and r = 1/4 with
probability 2/3? |
| Here is the solution. |
 (b)
(b)
 (d)
(d) (e)
(e)
 (b)
(b) (c)
(c)
 (e)
(e) (f)
(f)
 (b)
(b)
 (e)
(e) (f)
(f)
 (b)
(b)

 (b)
(b) (c)
(c)
 (e)
(e) (f)
(f)
 (b)
(b)
 (d)
(d)